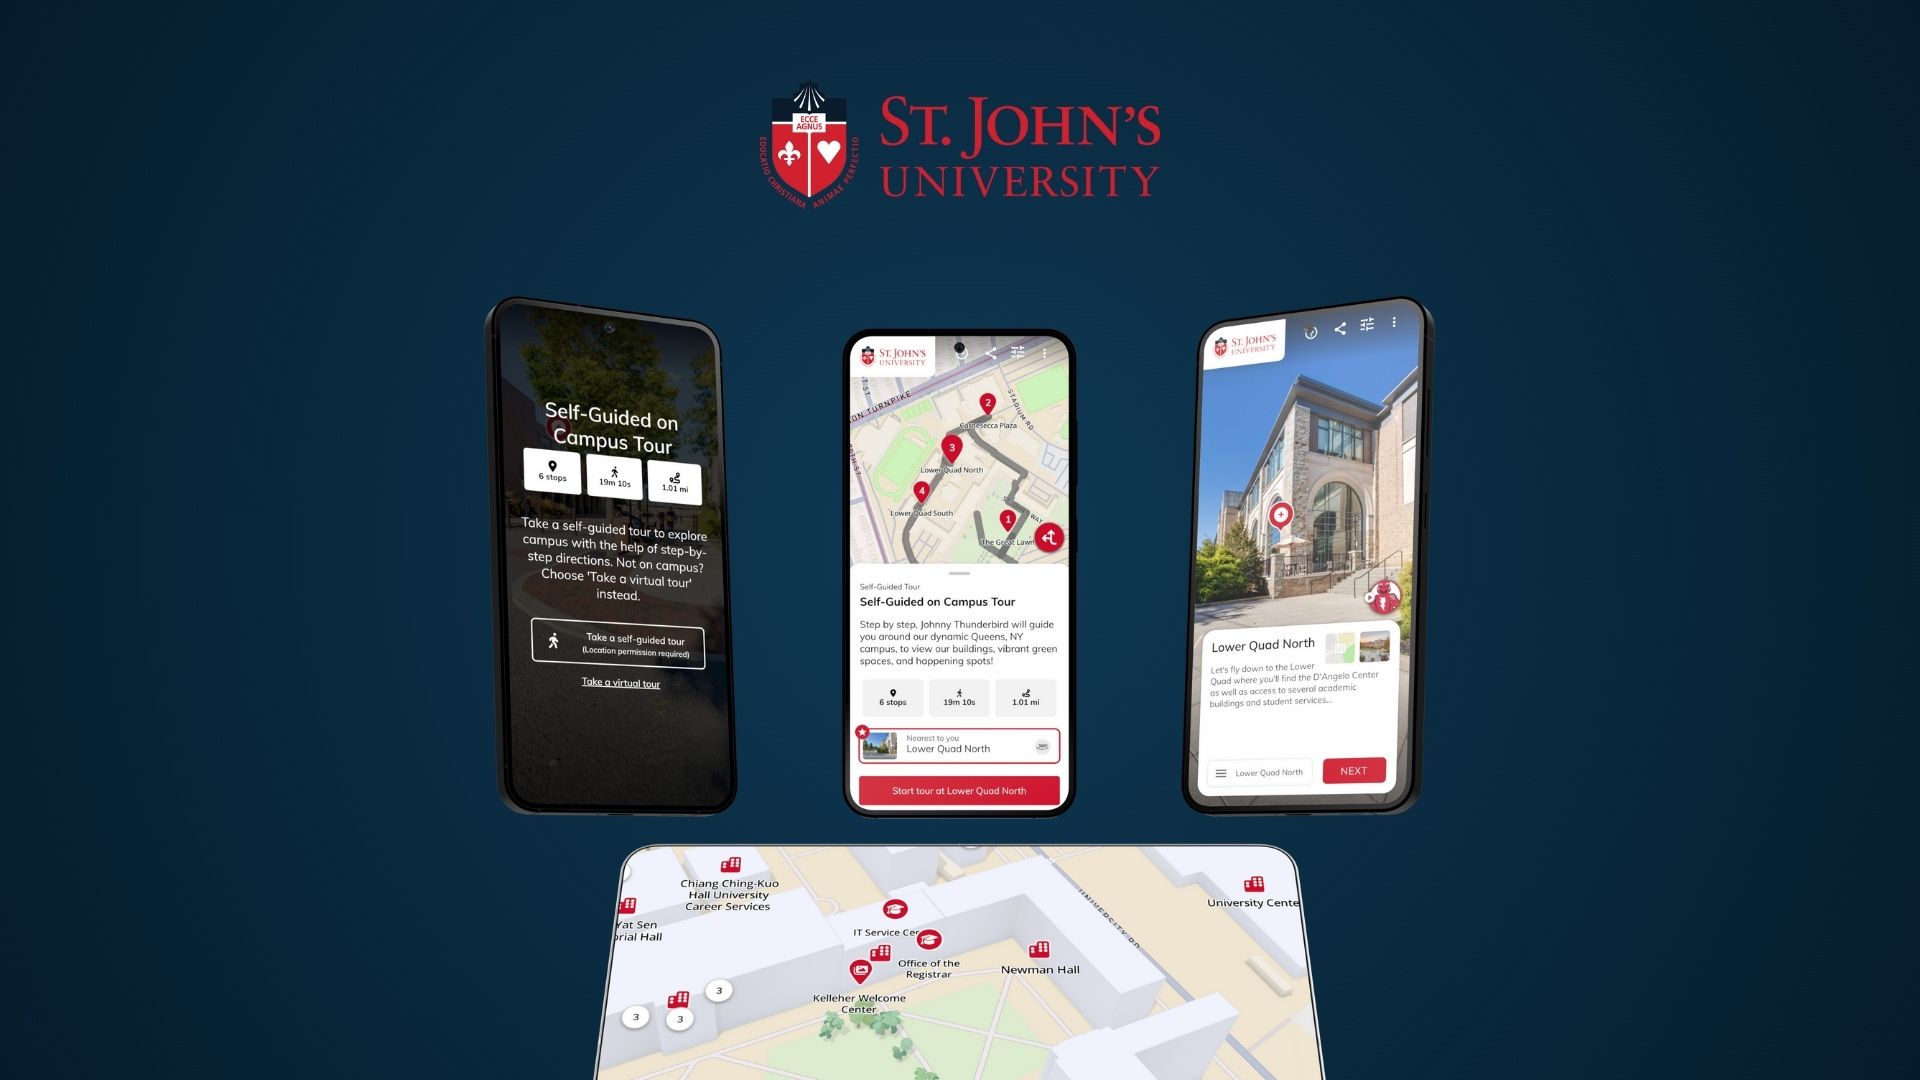
It’s hard to decide how long a tour should be when you first start a project. Some teams create large tours that showcase everything for users, while others break down tours into areas or themes that align with known audience interests. There is no perfect answer to the “right” length of tour, as it depends on many variables specific to your organization and audience. However, once your tour is launched, it is valuable to keep an eye on your analytics to optimize the user experience on a regular basis.
When it comes to evaluating the effectiveness of your tour length, there are a couple of analytics to pay attention to in order to decide when you should be adding more content:
1. Pages per session
By Google’s definition, pages per session is the average number of web pages a user visits in a given session. It’s calculated by dividing the number of page views by the total number of sessions. It is a reliable metric to measure how engaging your experience is. When it comes to virtual tours, more pages viewed means that users are more engaged with your story.
2. Finished tour events
In Google Analytics, events are user interactions with content other than page loads. These allow you to analyze interactions like downloads, link clicks, form submissions and more.
In your virtual tour, users who have viewed all the scenes in a tour will be shown a finished tour page. This fires an event that gets recorded in Google Analytics. By tracking tour completion events compared to your sessions, you can determine the percentage of users that are making it to the end of your experience.
Using these metrics to interpret your data
Once you’ve launched your virtual tour and have a data set built up, you can analyze pages per session and finished tour events in order to make decisions around growing your tour. Here are two possible scenarios to consider:
- Average pages per session is close or equal to the number of scenes on your tour → visitors are making it to the end of your tour offering.
- A finished tour event is present in a high % of sessions → most visitors are completing a tour during the session.
If these trends are present in your tour stats, congratulations! Your average visitor is consuming all the content available on your virtual tour. This reveals a big opportunity: users would likely consume more content if it was available.
Start considering ways to incorporate more content and explore what else you can you be sharing with your audience. Here are a few ways to grow your tours:
- Add more scenes to your tour. Grow your virtual experience with missed or new spaces to keep your tour up to date. Expanding a tour with high engagement will help users see more of what you have to offer.
- Create new hotspots on your tours. Hotspots are often the area of your tour that highlight those behind-the-scenes tidbits that visitors won’t learn anywhere else. They are the virtual equivalent to fun facts you learn from in-person tour guides and will keep users learning more about you.
- Use engagement to drive users to more tours. When a user finishes a tour, they’re presented with a screen that encourages them to check out other tours. Review popular content in your bigger tours. Consider making niche tours for different audience needs and drive additional page views.
These are just a few options to help expand your Circuit experience over time. Read about how to grow your virtual tour here.
Once you’ve added content, continue to monitor your analytics. If the trends indicate that users are completing tours at the same rate, repeat the process. Explore what else you can add that will engage visitors. By analyzing your data and testing changes on a regular basis, your tour performance will increase.
At Circuit, we are continually improving the experience of customers and end-users. Have questions about how to put these tips into action? Book a call with us to review your analytics!


.png)


