Analytics
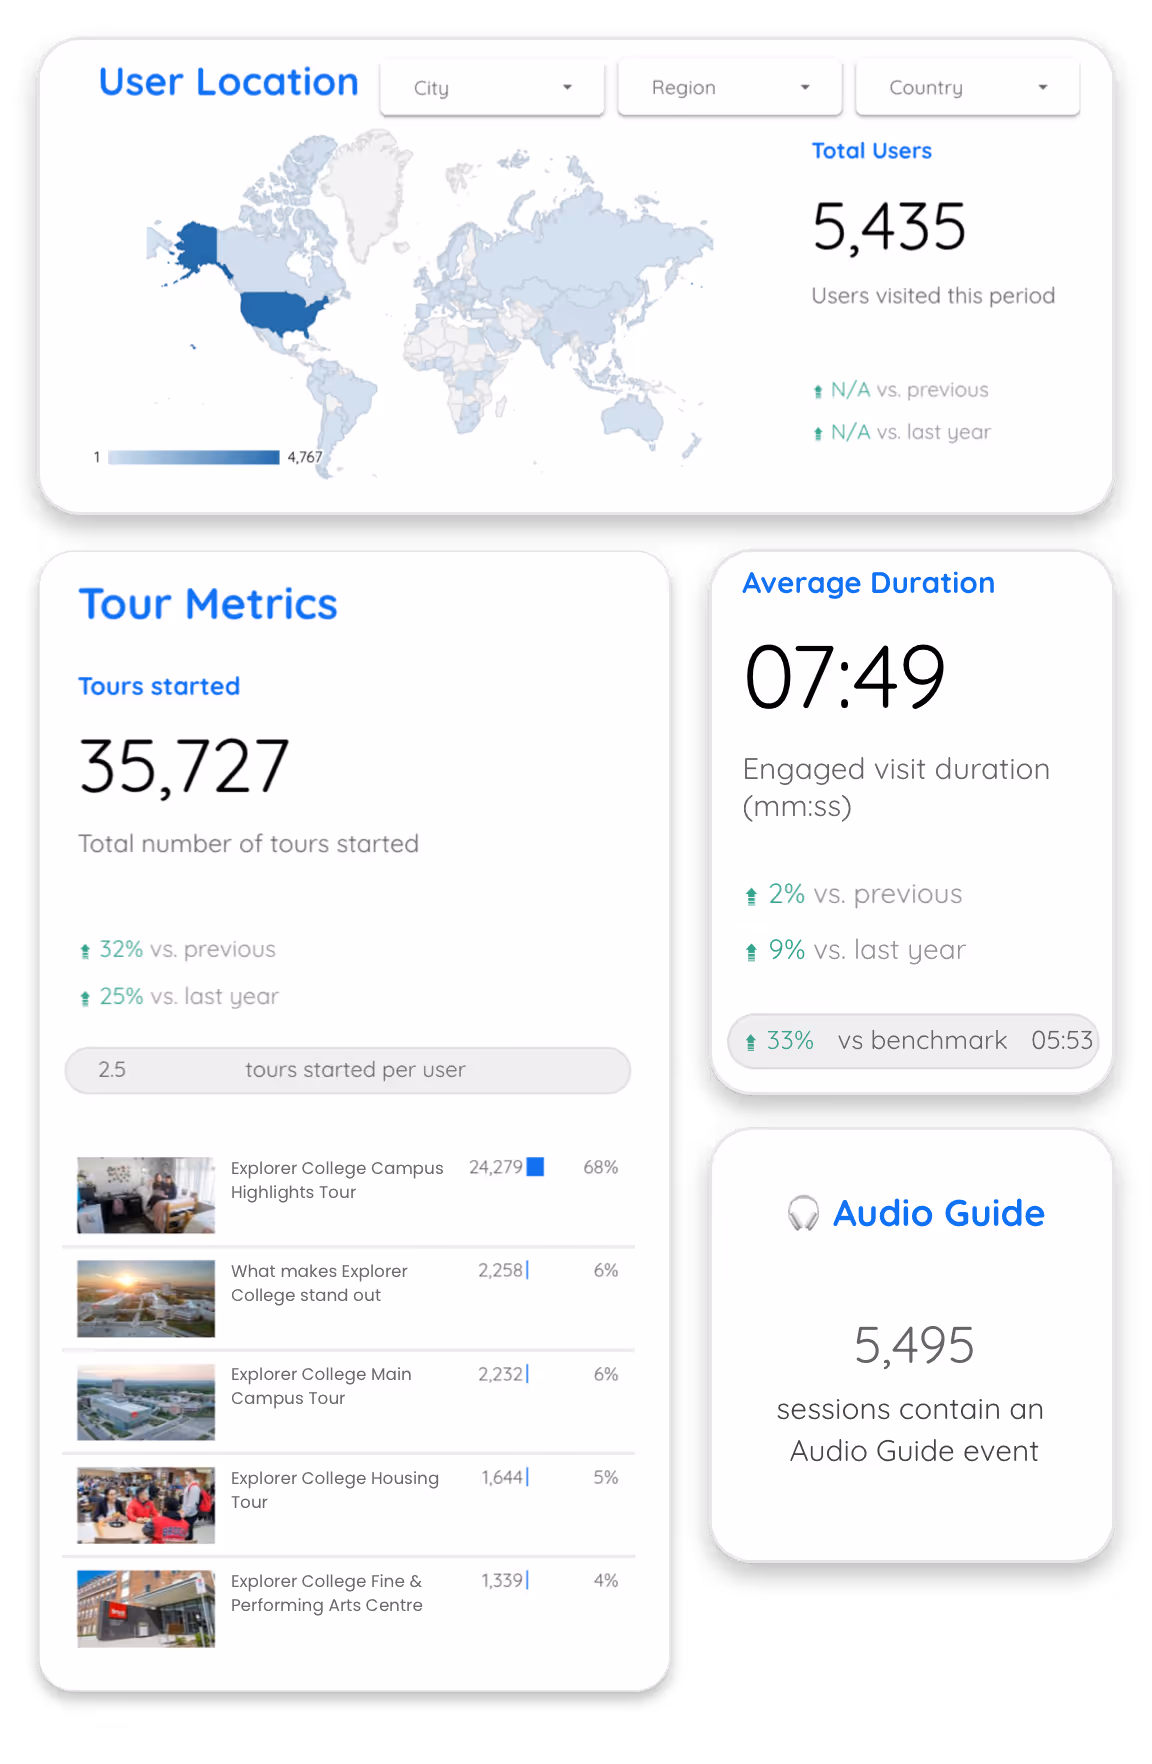
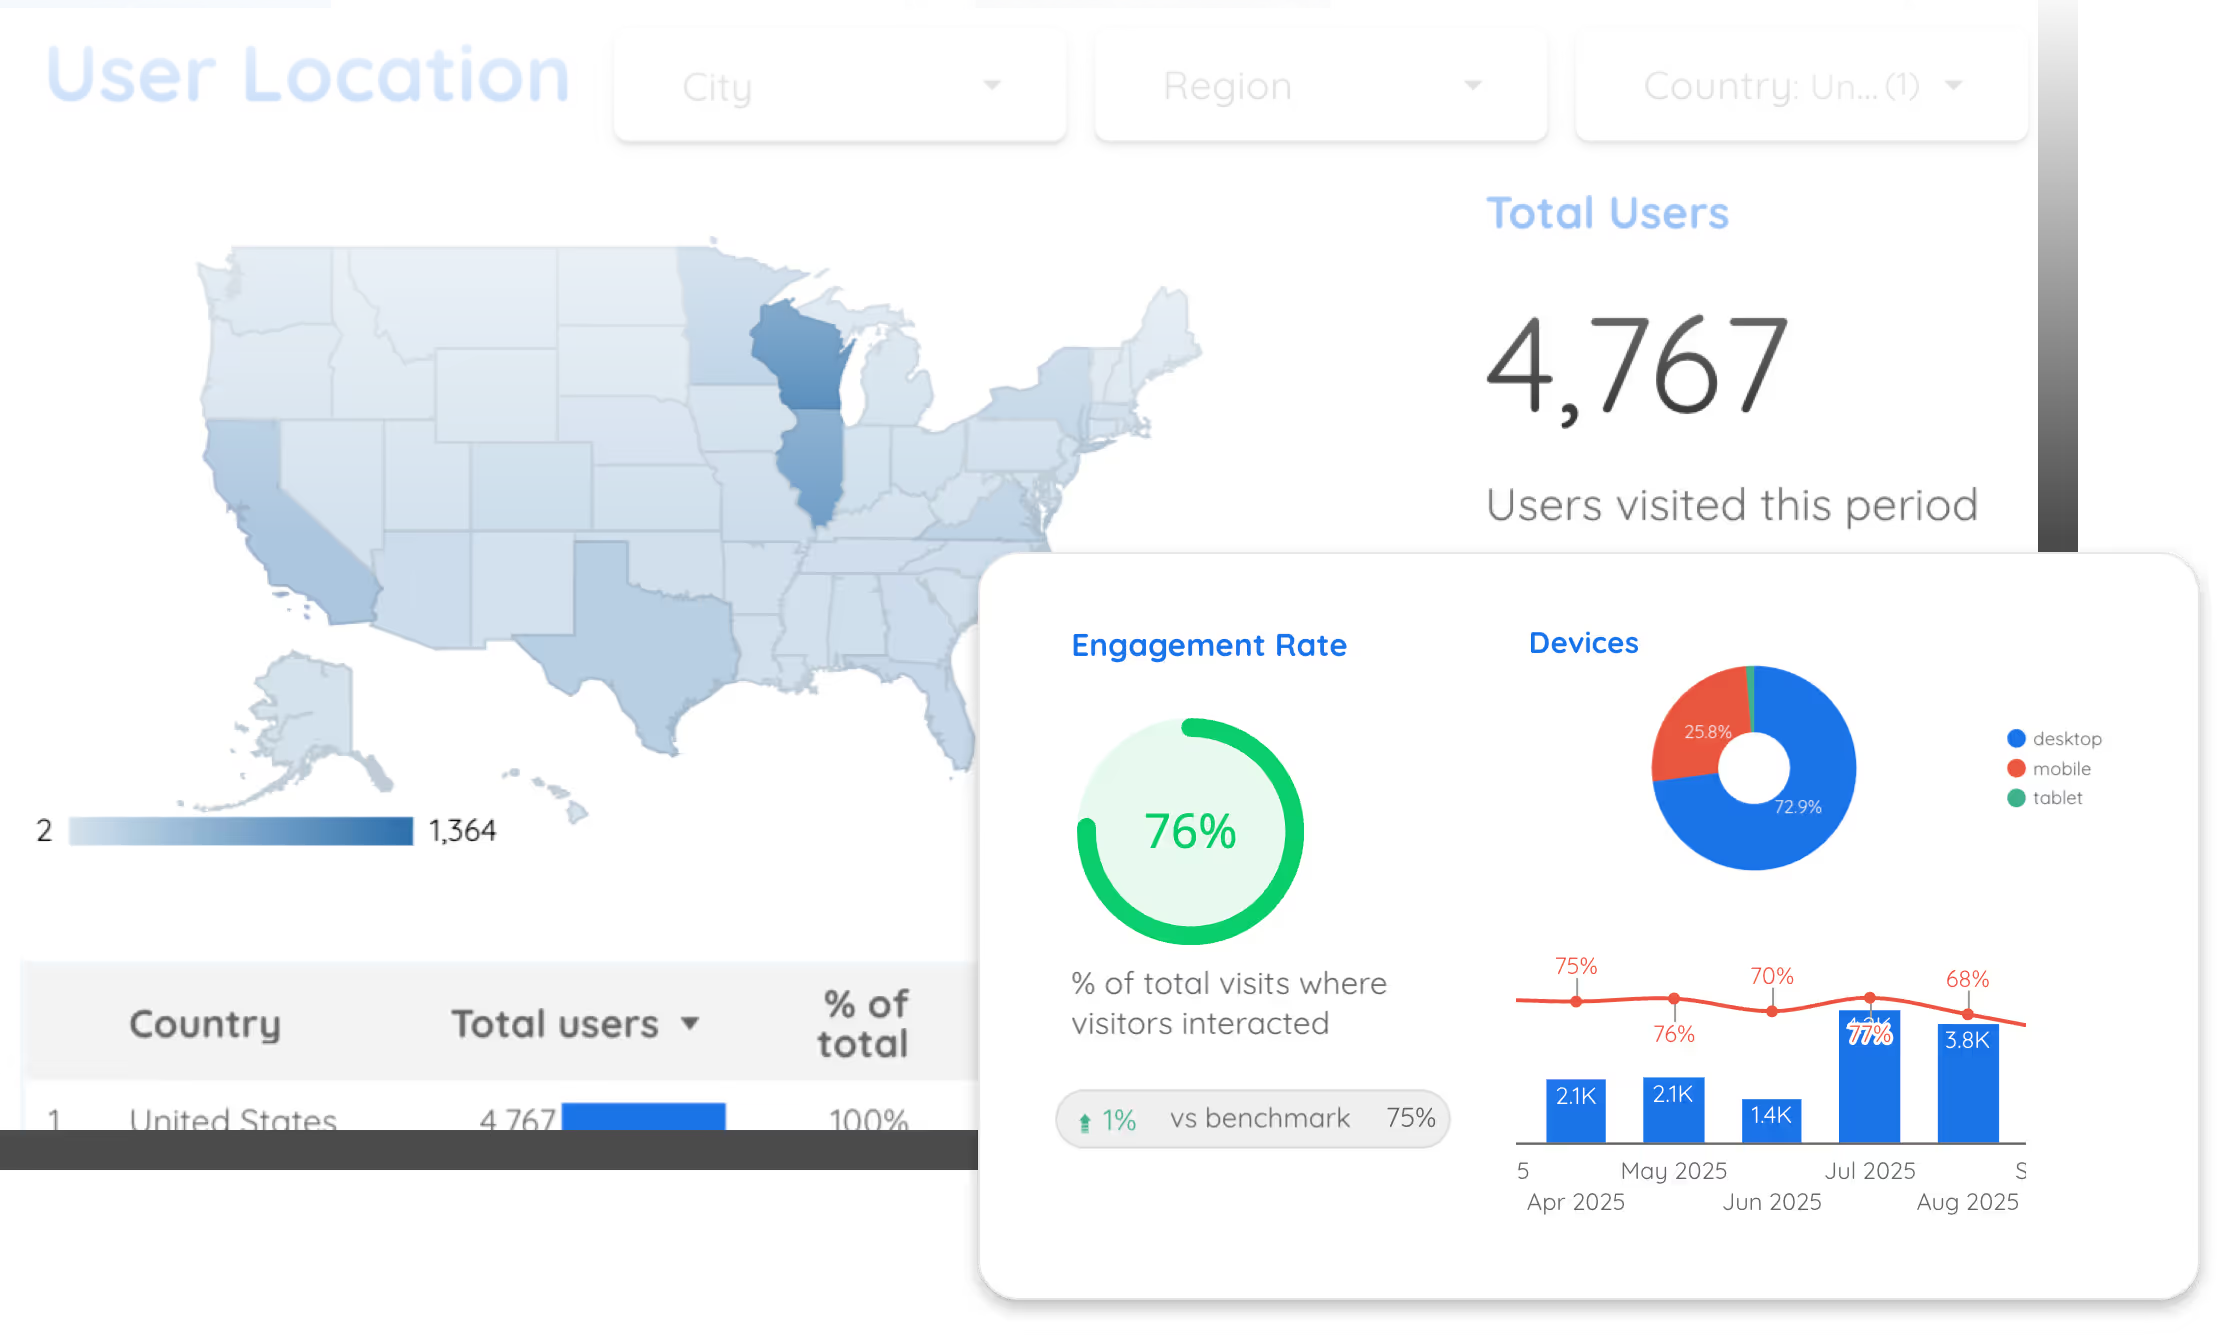
Learn the behaviour of your visitors through real-time dashboards, and understand who is using your tour and how.
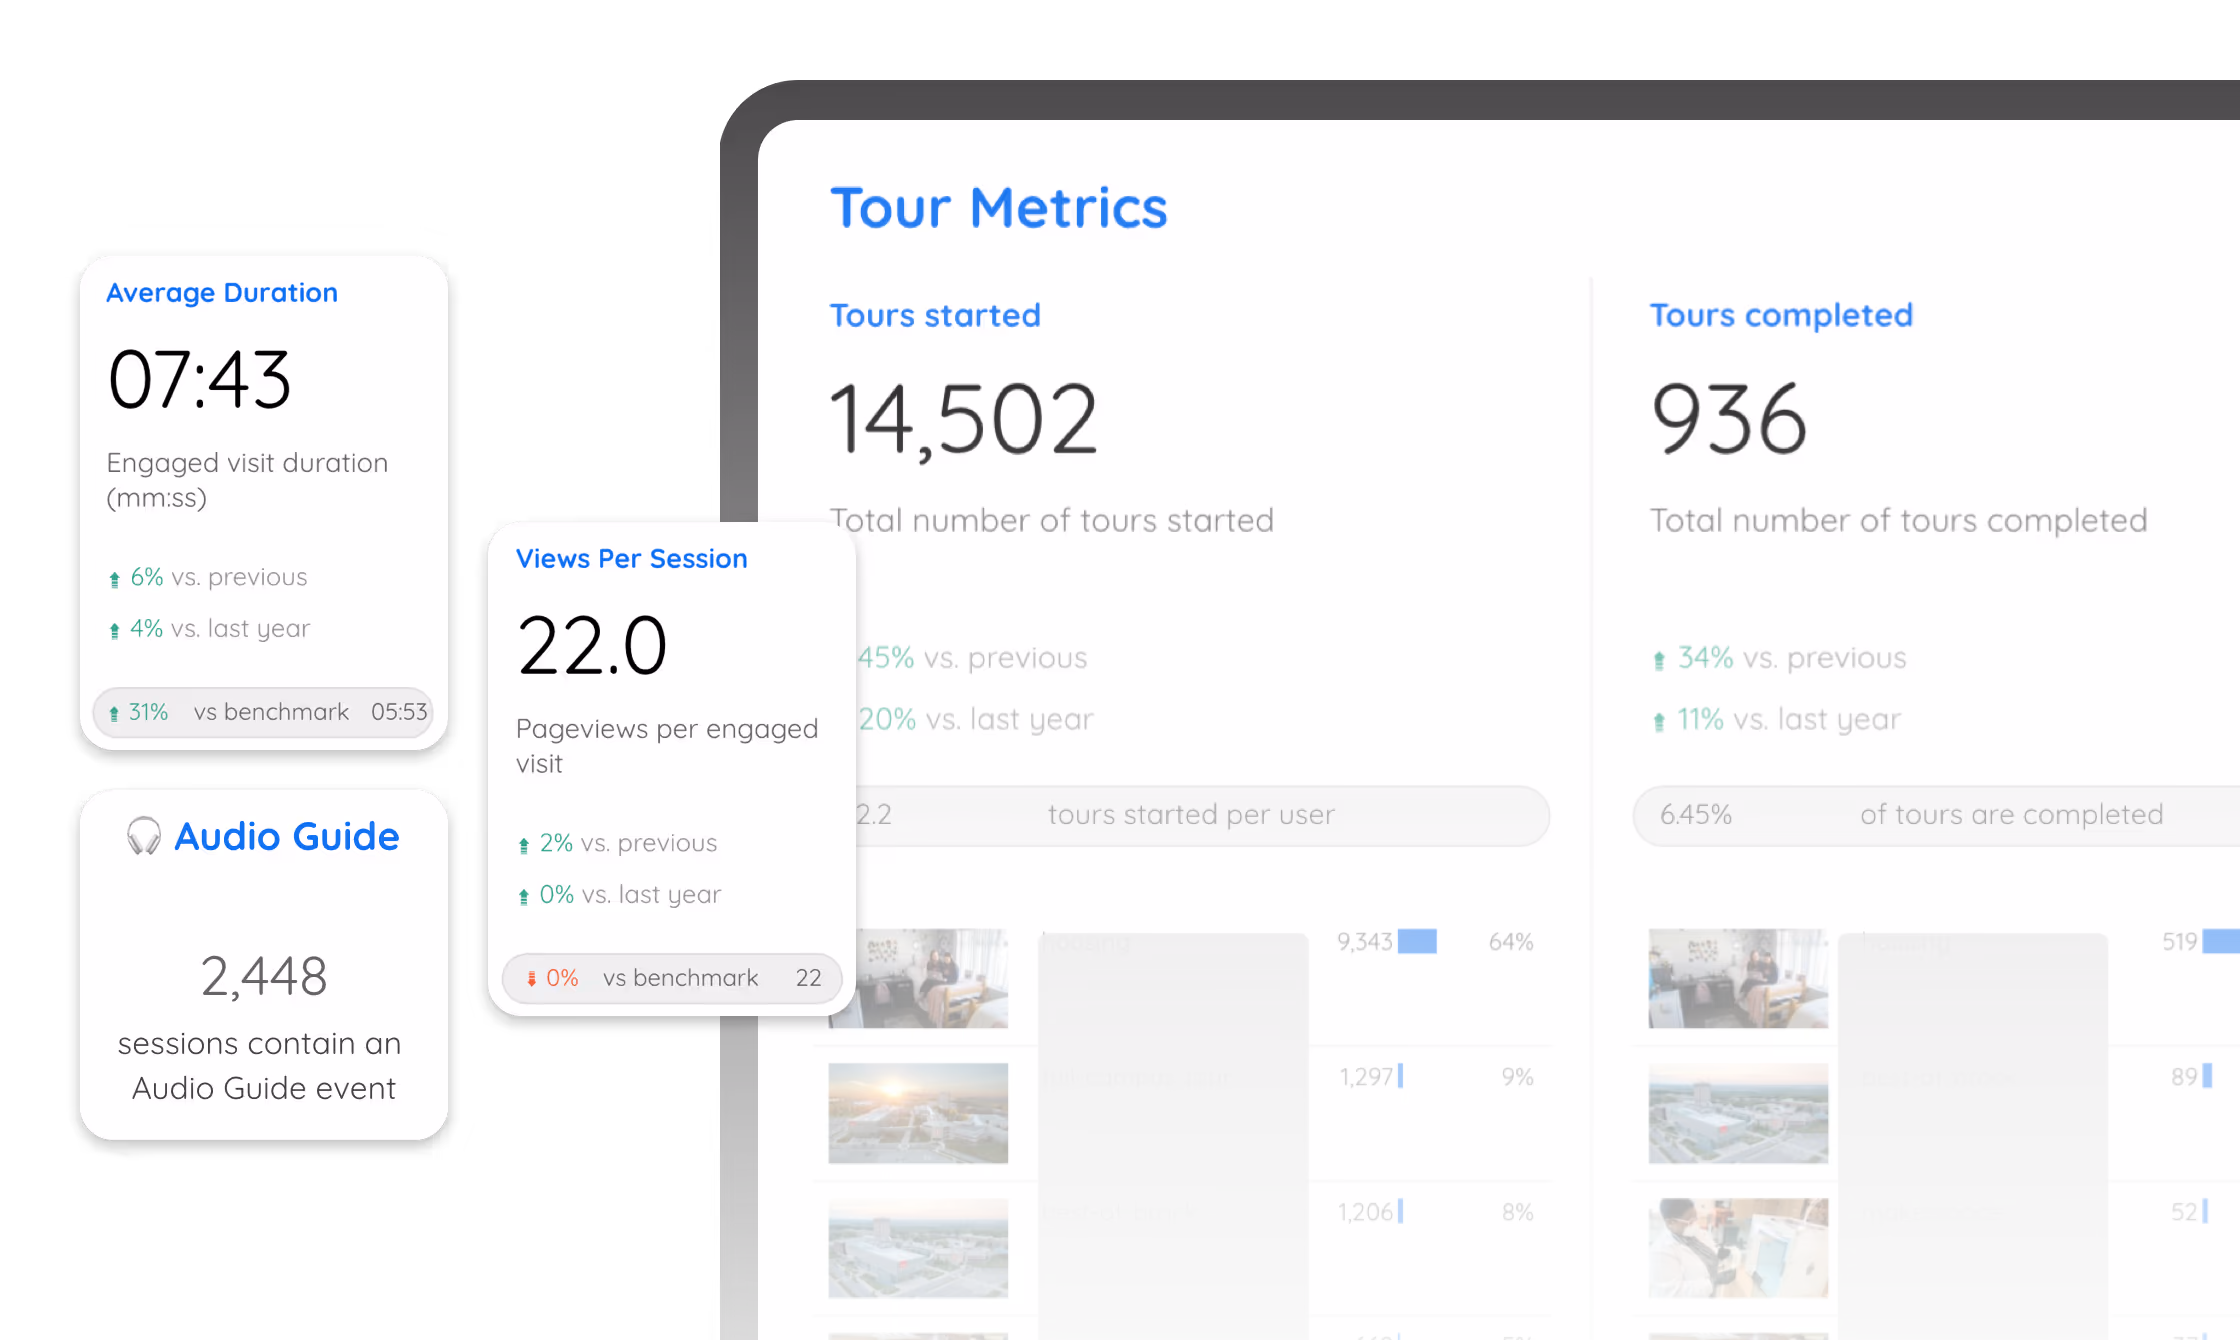
View metrics by scene, tour, or feature to identify which parts of your tour are driving stronger engagement from visitors.
Spend less time searching for proof points. Get clear data points about awareness, engagement, and conversion impact.
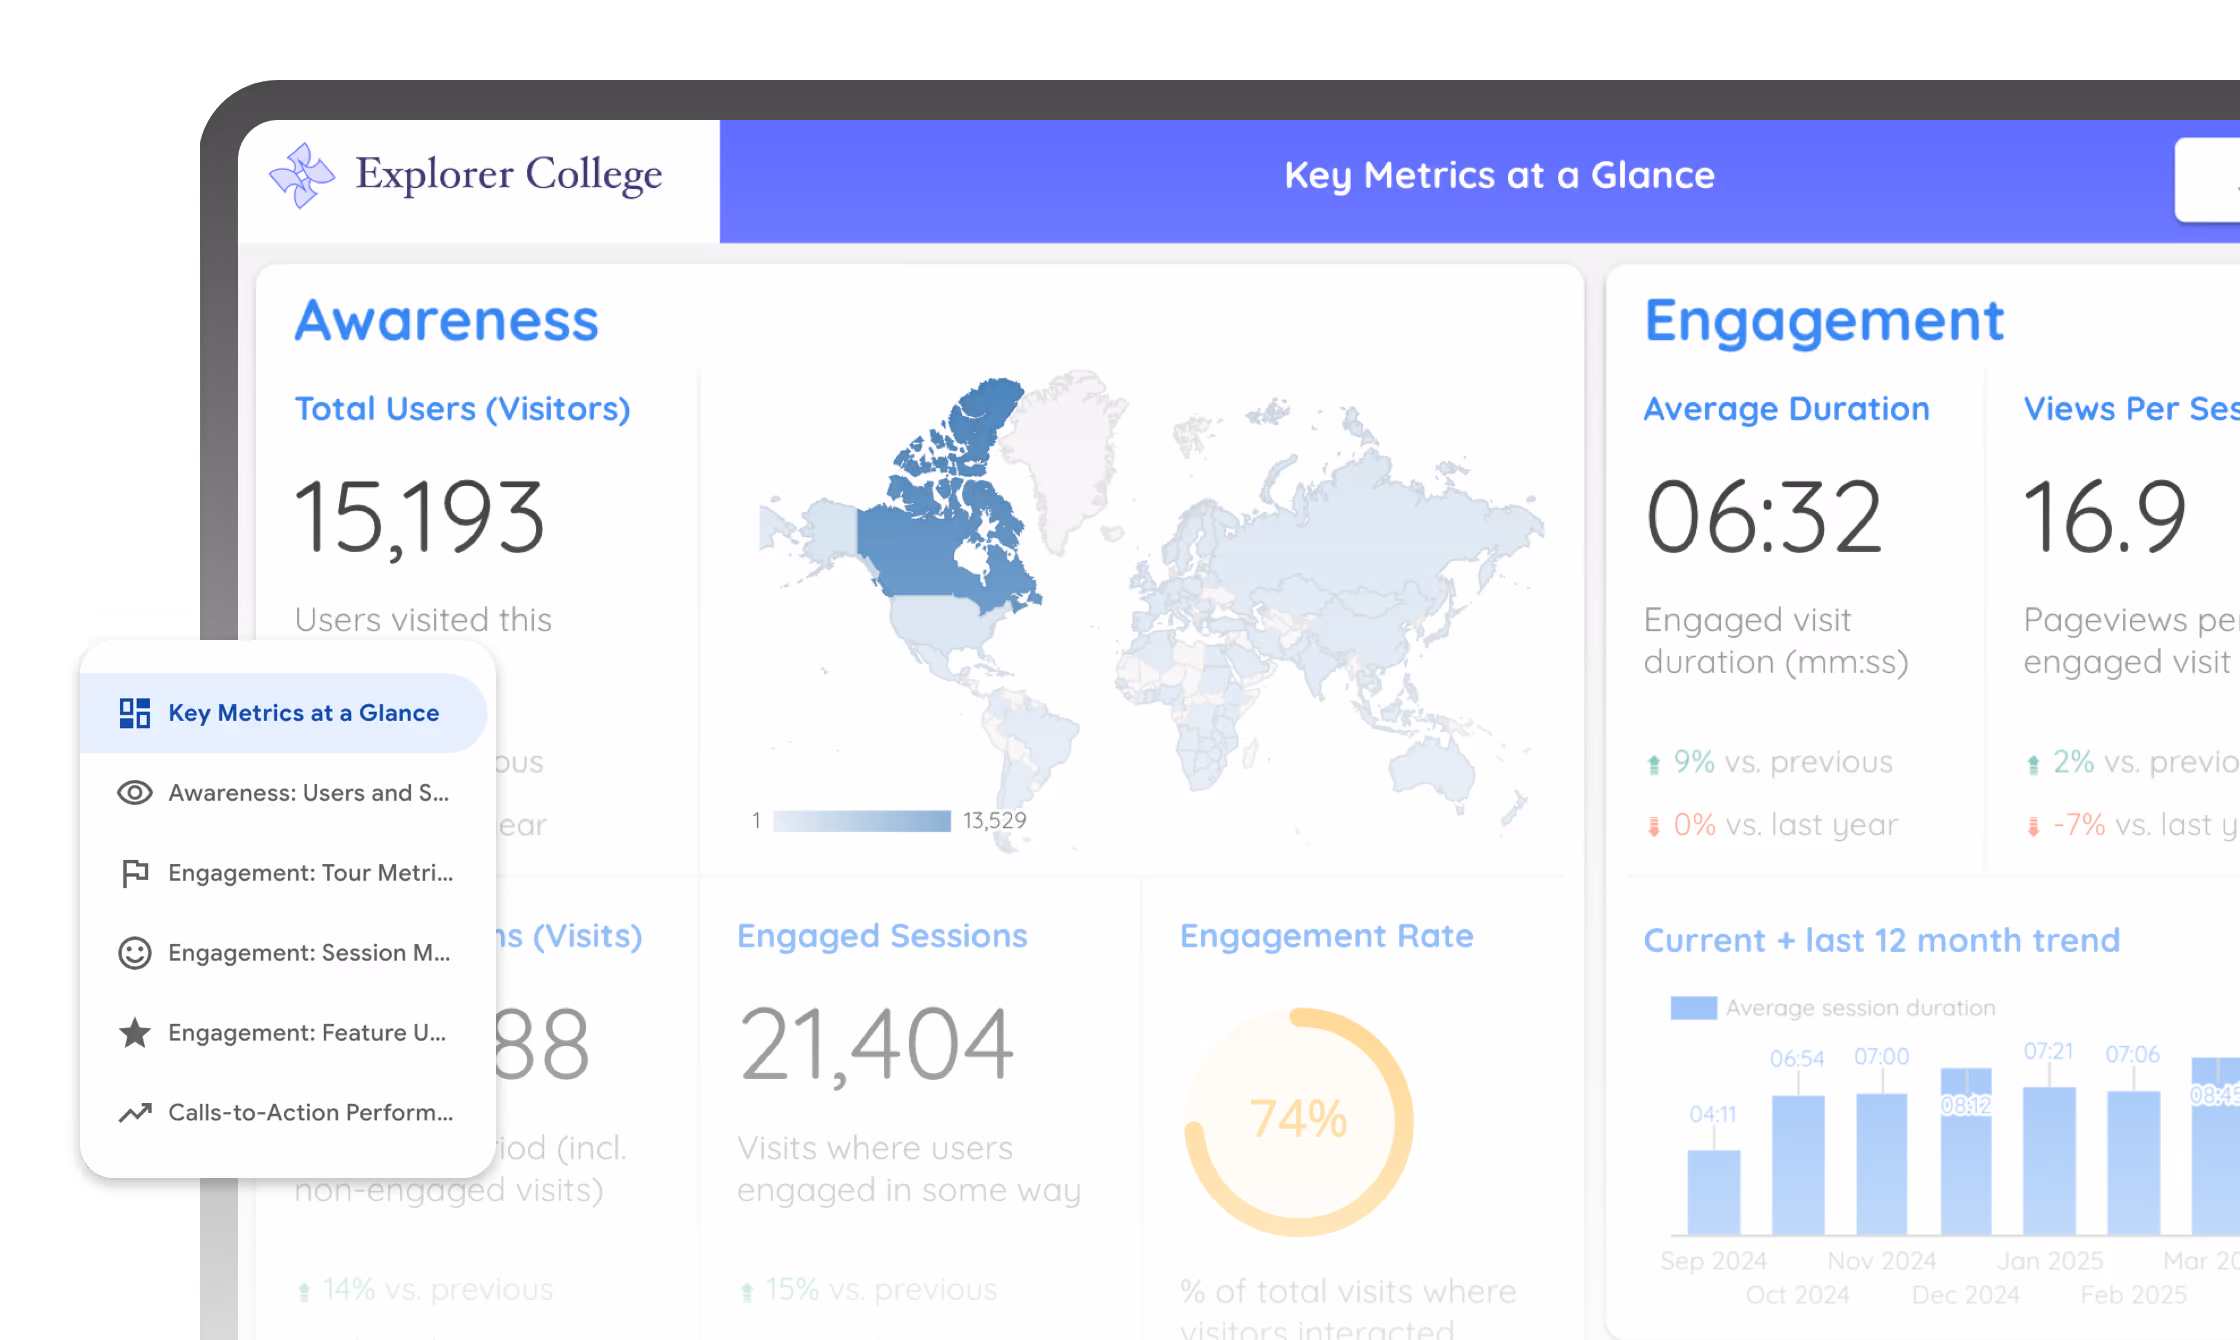

Circuit takes analytics to another level, their easy-to-use dashboard gives you all the important stats at a glance, without having to navigate through pages of numbers. Their team is able to make sense of the behavioural data and provide suggestions that have boosted the engagement of our visitors.

Get in touch with our team to discuss the best options for your business.